Hi! I'm Firdaus. I am a data enthusiast with expertise in data analysis and visualization. Some of the tools I'm familiar with are Looker Studio, Tableau, Python, and SQL. Here are some of my projects:
My Data Visualization Projects
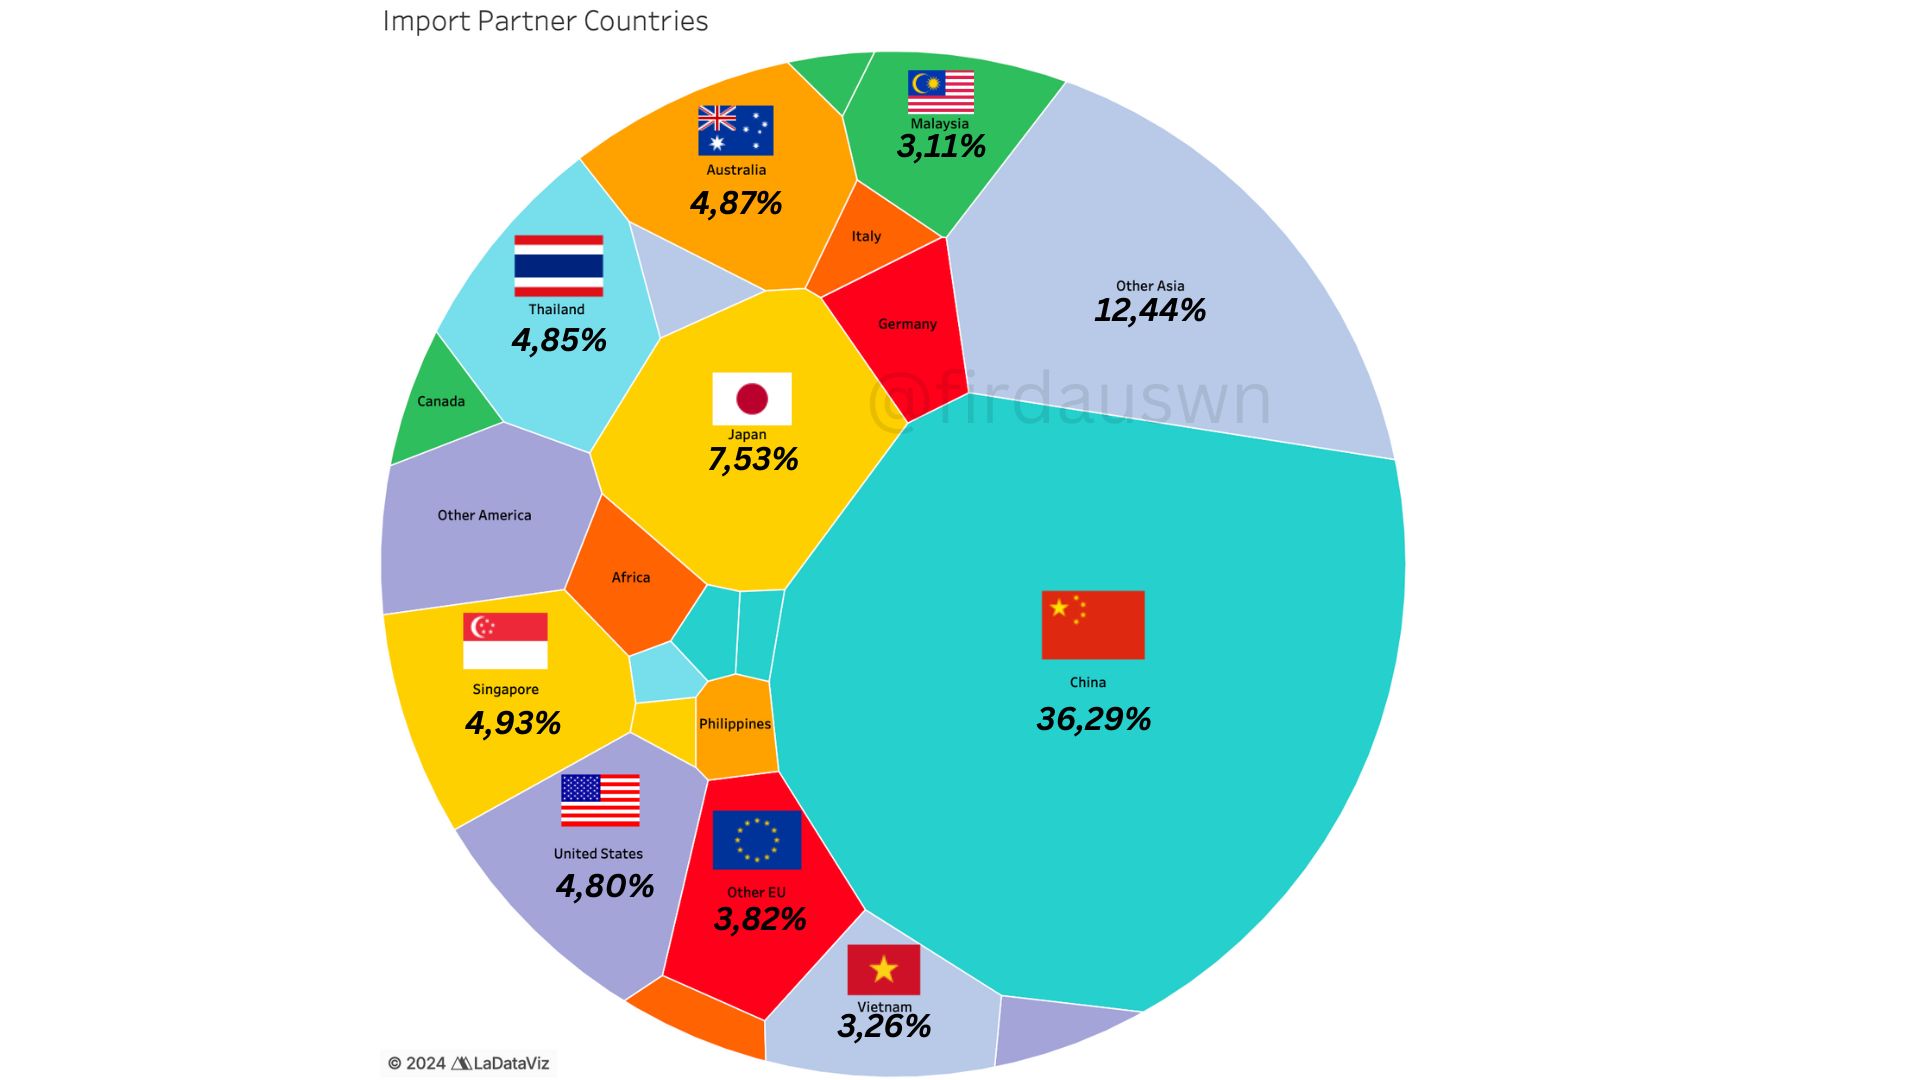
Post 7: Export-Import Partner Countries (2024)
International trade is a fascinating dataset to analyze, as it highlights which countries are most significant to our economy. There are various ways to categorize the data—by commodity, port, province, etc.—but for this analysis, I focus on Non-Oil and Gas Trade, as it represents the majority share: over 84% of total imports (total imports >233 billion USD, 2024) and more than 94% of total exports (total exports >264 billion USD, 2024).
Using data from Badan Pusat Statistik (BPS), I have visualized the trade flows through a Voronoi Treemap Diagram (by LaDataViz, Tableau).
✅ Non-Oil and Gas Imports are dominated by Asian countries, accounting for over 70% of the total, led by China (36.39%), Other Asia (12.44%), and several ASEAN countries.
✅ Exports are also heavily concentrated in Asia, with more than 70% of shipments destined for the region. The United States, reaching a double-digit share of 10.57%, presents a strong trade opportunity.
✅ China, Japan (2nd in imports & 3rd in exports), ASEAN countries, and the United States emerge as the most significant trade partners for Indonesia in terms of Non-Oil and Gas trade volume.
Post 6: Indosat and XL Sankey Diagram Financial Report FY2024
Telecommunications, particularly internet data, is one of the most fascinating industries. In Indonesia, Telkom Group leads the Revenue Market Share with 59%, followed by Indosat Ooredoo Hutchison (22%) and XL Axiata (13%) (Siahaan, 2025).
With the release of the Full Year 2024 Financial Reports for Indosat and XL from IDX website, I have visualized their financial details using a Sankey Diagram (by LaDataViz, Tableau).
✅ Cellular & Data services remain the primary revenue contribution for both Indosat and XL, contributing >84% of total revenue.
✅ EBITDA Margins from Indosat (47%) and XL (51%) exceed the industry average of 37% (Verma, 2024).
✅ EBITDA Margin is a crucial performance indicator for telecom companies, since their major capital investments in network infrastructure, which gets depreciated. This explains their relatively high depreciation values.
Coffeeshops have become a significant part of people's lifestyle, especially in Jakarta. They serve as spaces for work, meetings, or simply enjoying a book. With thousands of coffeeshops scattered across Jakarta, finding one isn’t difficult.
I scraped the data from Google Maps using a tool called Instant Data Scraper with the "cafe" keyword. After formatting and cleaning the data, I visualized it using Tableau.
Key Takeaways:
✅ There are more than 3,700 coffeeshops/restaurants in Jakarta, with over 300 open 24 hours.
✅ The majority fall in the IDR 25-50k price range (67%), followed by IDR 1-25k (17%) and above IDR 50k (15%).
✅ Warunk Upnormal Tebet, Filosofi Kopi Melawai, and Teras Rumah Nenek are the top three by number of reviews. For "more coffeeshops," Bakoel Koffie Bikini, Lucky Cat Coffee, and Anomaly Coffee Menteng stand out.
Post 4: Crude Oil Import Breakdown by Country (2017-2021)
This chart represents the import of crude oil and its products based on the country of origin from the years 2017 to 2021 (source: BPS website). The data is presented in percentage form (based on net weight in 000 tons) and visualized using a pie chart race from the sjvisualizer Python library.
✅ Singapore consistently held the top position from 2017 (31%) to 2021 (24%).
✅ Malaysia and Saudi Arabia were the next major contributors, with a combined total of 27%.
✅ The United States and Nigeria were the only other countries approaching 10% in import value, while others had relatively smaller shares.
✅ The top five countries accounted for a total of 71% of the overall import value.
Post 3: Visualizing Apple's Remarkable Success in 2022
After the pandemic recession, Apple has stood out and achieved remarkable success in 2022. Apple has dominated the market with its flagship product, the iPhone, and its Service line business has seen significant growth.
To better understand Apple's financial performance in 2022, I created a Sankey Chart using Microsoft Power BI and Apple's Form 10-K 2022.
Post 2: GDP ASEAN vs GDP Per Capita ASEAN (1980-2022) – Where is Indonesia?
GDP (Gross Domestic Product) represents the total value of goods and services produced within a country. GDP per capita is calculated by dividing GDP by the total population.
🔵 GDP in ASEAN grew from $99B in 1980 to $3.6T in 2022.
🔵 Indonesia has the largest GDP at $1.3T (36% of ASEAN GDP), followed by Thailand, Singapore, and Malaysia (60% combined).
🔵 In terms of GDP per capita, Indonesia ($4,798) lags significantly behind Singapore ($82,808), Brunei ($37,667), Malaysia ($12,364), and Thailand ($7,651).
Post 1: Bar Chart Race of Investment Growth (2010-2022)